Bay Area Luxury Home Sales Doubled in February
Executive Summary:
- Sales of Bay Area homes priced above $3 million doubled in February, with most local regions posting large gains.
- Sales of homes priced higher than $1 million also continued to grow.
- Regionally, East Bay sales slowed, while Silicon Valley and the Wine Country saw more sales this February.
- The Bay Area median price jumped another 16 percent year over year, though high-end sales drove a large part of the increase.
- Buyer demand is not abating amid market challenges. Seven in 10 Bay Area homes sold for more than asking price, with the average premium increasing to 12 percent, up from 8 percent premiums observed in the last two Februarys.
- Thirty-year, fixed-rate mortgages reached 4.46 percent as of March 8, 2018 according to a Freddie Mac survey, the highest since the spring of 2014.
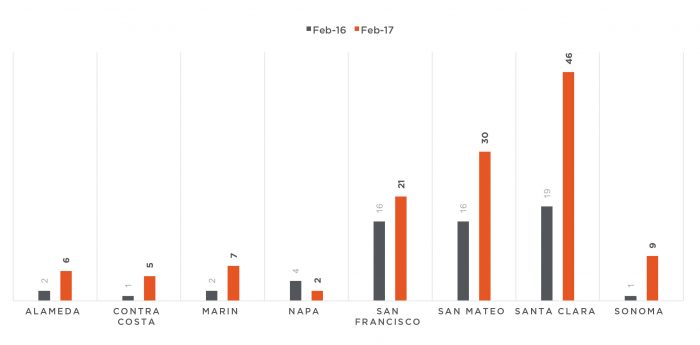
Bay Area homebuyer demand remained strong in February despite concerns over tax changes, rising mortgage rates, and stock market volatility. While overall activity remained flat year over year in February, sales of homes priced above $3 million doubled to about 126 for the eight-county Bay Area (excluding Solano County). The largest relative jump in luxury sales occurred in Sonoma County, which had nine high-priced sales. During the last two Februarys, only one and three such sales were recorded in Sonoma County. Notable jumps in high-priced sales were seen in all Bay Area regions except Napa County, were fewer sales were recorded when compared with last February. Figure 1 summarizes sales of homes priced at $3 million-plus by Bay Area county. Also note that the data presented in Figure 1 relies on MLS data, and since not all sales are recorded in the MLS, the number of transactions could be higher.
Figure 1: Number of $3 million-plus home sales by Bay Area county
Source: Terradatum, Inc. from data provided by local MLSes, March 7, 2018
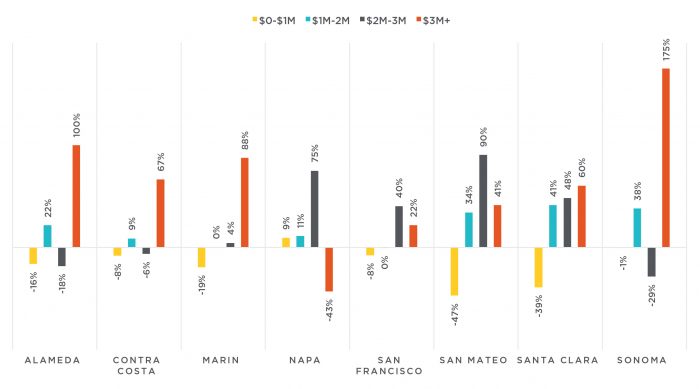
Along with the large increase in higher-priced sales, most Bay Area regions also saw solid upticks in homes priced between $1 million and $3 million, with the largest relative increase in Silicon Valley. Sales of homes priced between $1 million and $2 million increased by 30 percent year over year, while sales of homes priced between $2 million and $3 million grew by 33 percent from last February.
Homes sales below $1 million continued shrinking, consistent with rapidly declining inventory at that price point, dropping by 15 percent. Interestingly, despite fewer homes for sale below $1 million in San Francisco and Napa counties, sales at that price point picked up slightly from the year before, up 4 percent and 11 percent, respectively.
Year over year, sales activity grew in some regions and declined in others. Alameda and Marin counties saw sales fall by about 8 percent. In contrast, San Mateo, San Francisco, and Napa counties all posted solid increases, with San Mateo leading with a 21 percent uptick. Most of the increase in San Mateo County was for homes priced above $2 million. Santa Clara and Sonoma counties maintained their overall annual levels of activity, though higher-priced sales again compensated for losses at lower price points. Figure 2 summarizes year-to-date changes in Bay Area home sales by price range.
Figure 2: Year-to-date change in home sales by price range and Bay Area county
Source: Terradatum, Inc. from data provided by local MLSes, March 7, 2018
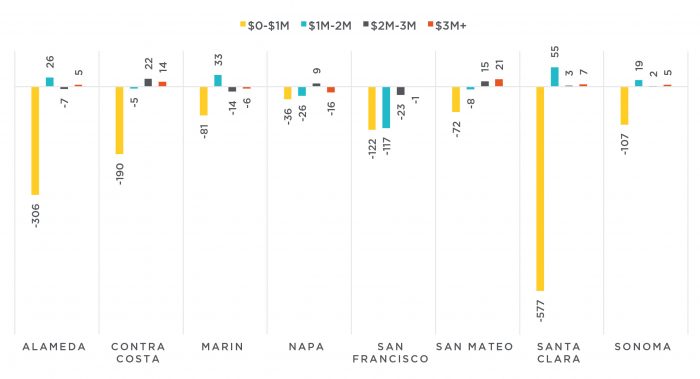
In addition, overall inventory continued to trend down, with 13 percent fewer homes on the market in February compared with last year. Nevertheless, the seasonal increase in inventory generally seen in February from the month before was almost double this year than in 2017, suggesting that the spring home-selling season could have started sooner this year. In Marin County, the seasonal monthly increase in inventory jumped by 44 percent from January, compared with a 25 percent increase last year and a 33 percent gain in 2016. Also, while lower-priced Bay Area inventory declined year over year, there were slightly more homes priced at $3 million-plus when compared with last year, especially in Contra Costa County, which posted a 37 percent increase — though this continues a trend that started in the second half of last year.
While year-over-year inventory fell in every region, the declines continued to be most pronounced in Santa Clara and San Francisco counties, where there were 20 percent fewer homes on the market than last year. Figure 3 illustrates year-over-year changes in inventory levels by price range. The dramatic decrease in affordable homes highlights a major challenge that Bay Area homebuyers face.
Figure 3: Year-over-year change in the number of for-sale homes by price range and Bay Area county.
Source: Terradatum, Inc. from data provided by local MLSes, March 7, 2018
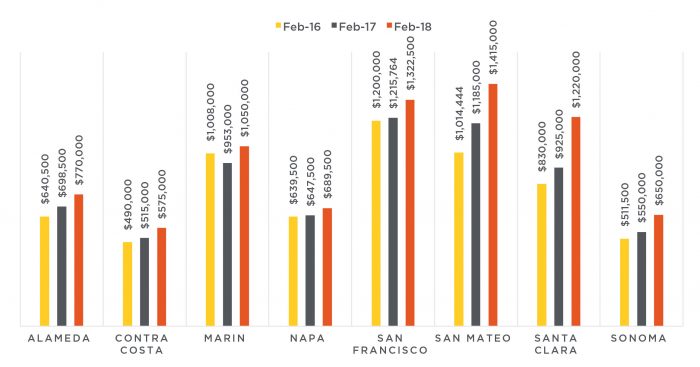
The supply-demand imbalance continued to push home prices higher. Median home prices once again jumped by 16 percent year over year, though most of the increase was driven by a spike in higher-priced homes. According to CoreLogic’s Home Price Index, which accounts for changes in the types of sales, Bay Area prices increased by 10 percent year over year in January and reached $875,000 in February. Figure 4 illustrates February median home prices over the last three years, with a relatively larger 2018 annual increase notable in most regions than recorded the year before.
Figure 4: Median home prices by Bay Area county in February 2016, 2017, and 2018
Source: Terradatum, Inc. from data provided by local MLSes, March 7, 2018
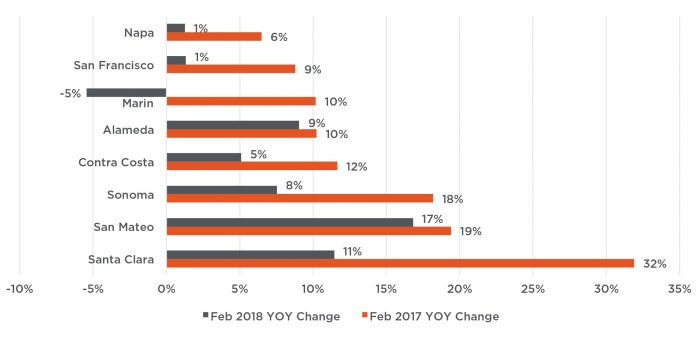
While median price growth remains strongest in Silicon Valley, post-wildfire activity in Sonoma County is putting pressure on prices there. Sonoma and Contra Costa counties showed the strongest growth for homes priced below $1 million: 12 percent year over year. Unlike Contra Costa County, Sonoma County posted robust price growth at higher price points. Figure 5 ranks the eight counties by February’s year-over-year median price change over the last two years.
Figure 5: Year-over-year change in prices by Bay Area county, February 2017 and February 2018
Source: Terradatum, Inc. from data provided by local MLSes, March 7, 2018
Buyers remained competitive despite some headwinds facing the housing market, such as rising mortgage rates, tax changes, and stock market volatility. In February, 70 percent of homes sold for more than asking price, up from 57 percent last February. While the share of homes selling for more than asking price has been continuously increasing, part of the growth may be partially due to changing pricing strategies among real estate professionals, who may list homes slightly below market price in an effort to generate greater demand from buyers. Still, the share of overbids increased across the entire Bay Area, again with the most growth in Santa Clara County, where 86 percent of homes sold over the asking price in February. San Francisco was the only local region where the share of overbids remained about the same on an annual basis, with 67 percent fetching premiums, though homes priced below $1 million saw a 10 percent point drop in those that sold for more than asking price. The East Bay also saw fewer overbids for homes priced between $2 million and $3 million.
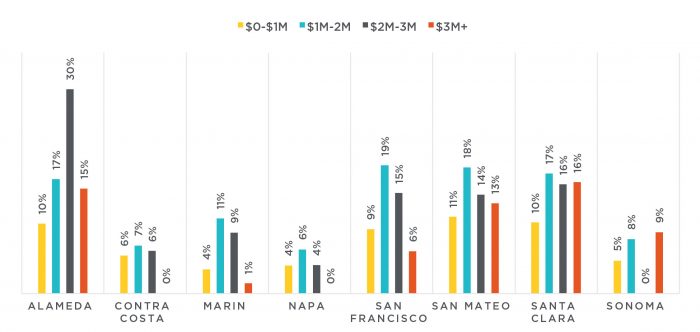
Homes that sold for more than asking price generally received 12 percent premiums, up from 8 percent premiums recorded during the last two Februarys. Figure 6 summarizes premiums paid in February; Alameda County’s $2-million-to-$3-million price range appears to have been highly sought after, followed by the $1-million-to-$2-million price range in San Francisco and Silicon Valley.
Figure 6: Premium paid by price range and Bay Area county.
Source: Terradatum, Inc. from data provided by local MLSes, March 7, 2018
All told, demand for homes in the Bay Area does not seem to have abated despite the aforementioned challenges. Nevertheless, the impact of rising mortgage rates over the last month may still be too recent for the data to reflect. According to Freddie Mac’s latest Primary Mortgage Market Survey, 30-year, fixed-rate mortgages climbed to 4.46 percent as of March 8, 2018, which is the highest since the spring of 2014. But the rise in mortgage rates may be creating urgency among buyers. According to the Mortgage Bankers Association, the unadjusted Purchase Index increased 13 percent from last week and was 1 percent higher compared with the same week in 2017.
The fortunately short-lived stock market jitters did not appear to shake homebuyer confidence. Lastly, the recently enacted tax reforms will take some time for the data to reflect, though it may be a few years before the housing market sees the full impacts.
Selma Hepp is Pacific Union’s Chief Economist and Vice President of Business Intelligence. Her previous positions include Chief Economist at Trulia, senior economist for the California Association of Realtors, and economist and manager of public policy and homeownership at the National Association of Realtors. She holds a Master of Arts in Economics from the State University of New York (SUNY), Buffalo, and a Ph.D. in Urban and Regional Planning and Design from the University of Maryland.
 TEAM WAKELIN