Bay Area Luxury Housing Market Pulls Back While Los Angeles Holds Steady

Executive Summary:
- Luxury home sales took a pause in the third quarter after a strong second quarter, particularly in the Bay Area, although they were in line with seasonal trends seen in prior years.
- While Los Angeles luxury home sales have generally trended higher since 2016, the Bay Area saw a dip in luxury sales in 2017 followed by a 2018 rebound.
- Luxury buyer sentiment was stronger in Los Angeles in the third quarter than in the Bay Area, with an improved list-price-to-sales-price ratio and fewer days on the market.
- Bay Area luxury buyers were hesitant, with homes lingering longer on the market and larger average discounts.
- The inventory of luxury homes in Los Angeles continues to increase, especially in the third quarter.
- The inventory of luxury homes in the Bay Area retracted in the third quarter.
Sales of luxury homes picked up over the last two years in the Bay Area and Los Angeles housing markets. However, with home sales activity generally slowing since the summer, it appeared that high-end activity might pull back. With more September activity, though, the quarter ended on a solid note — or at least in line with third-quarter activity seen in the two previous years.
Luxury homes are defined here as those priced higher than $20 million in Los Angeles and higher than $10 million in the Bay Area, since the latter has relatively fewer sales of homes over $20 million. The data in this analysis encompasses transactions recorded in local MLSes, and thus off-market transactions are not accounted for.
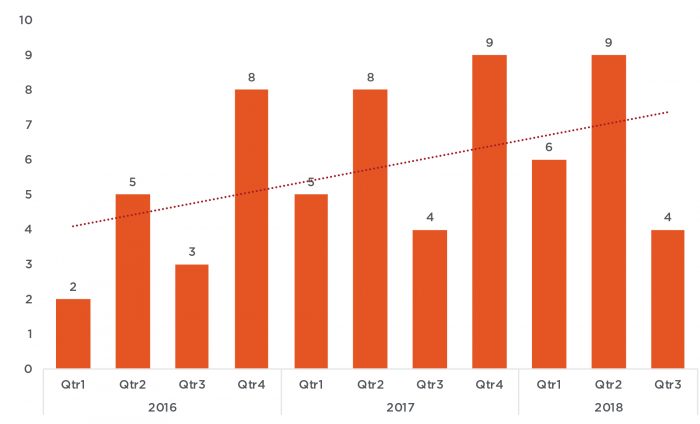
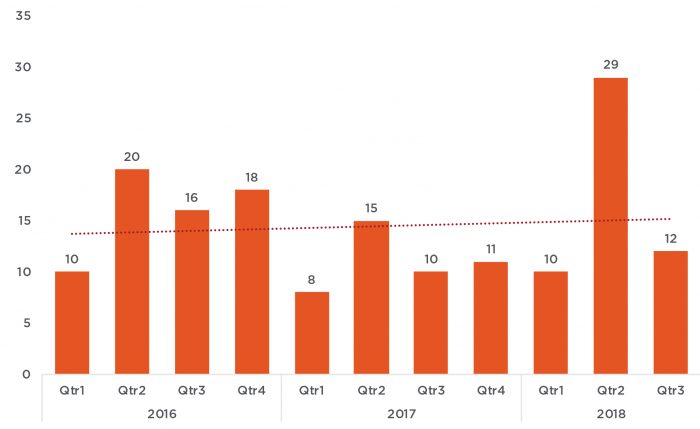
In Los Angeles, sales of homes priced above $10 million in 2017 increased by 39 percent compared with the same period in 2016 and 42 percent in 2018 compared with 2016. In the Bay Area, sales of higher-end homes saw a dip in 2017, followed by a 2018 rebound above the levels seen in 2016. Figures 1 and 2 illustrate quarterly sales activity of luxury homes in Los Angeles and the Bay Area. In the Bay Area, the strongest activity for luxury homes was in the second quarter of this year, with sales almost double the sales during the same period last year. The third quarter reversed from the second-quarter high and brought sales back in line with last year’s third quarter in both regions. While third-quarter activity totaled less than half of the prior quarter’s sales, the pullback may indicate normalization of luxury sales or some reservation among high-end buyers.
Figure 1: Los Angeles quarterly sales of homes sold at $20-plus million
Source: Terradatum, Inc. from data provided by TheMLS, Oct. 7, 2018
Figure 2: San Francisco quarterly sales of homes sold at $10-plus million
Source: Terradatum, Inc. from data provided by four local MLSes, Oct. 7, 2018
And while the total transaction count of four sales in the third quarter in Los Angeles makes it difficult to definitively see where the luxury market is heading, Figures 3 through 6 provide additional market indicators that may suggest the trend.
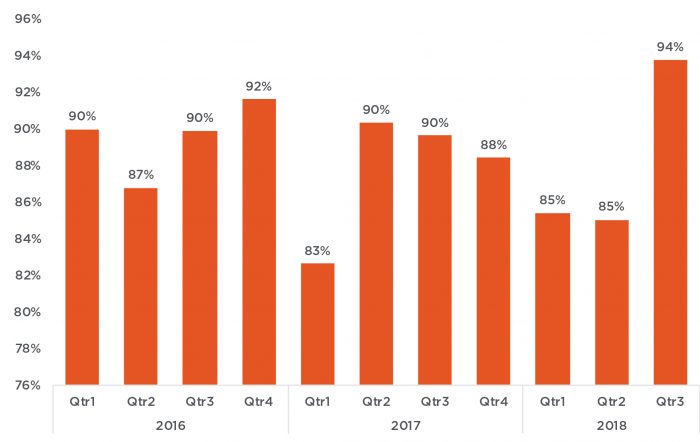
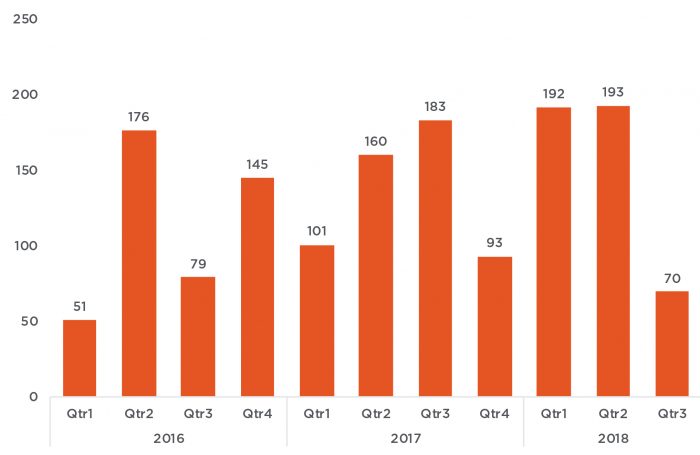
In Los Angeles, the sales-price-to-list-price ratio improved notably in the third quarter, averaging 94 percent, following an 85 percent average in the two prior quarters and a 90 percent average during the same period last year. Also, the average number of days a home was on the market before it sold declined to 70 days, following the 193-day averages in the prior two quarters and 183 days during the same period last year.
Figure 3: Los Angeles average list-price-to-sales-price ratio
Source: Terradatum, Inc. from data provided by TheMLS, Oct. 7, 2018
Figure 4: Los Angeles average days on market
Source: Terradatum, Inc. from data provided by TheMLS, Oct. 7, 2018
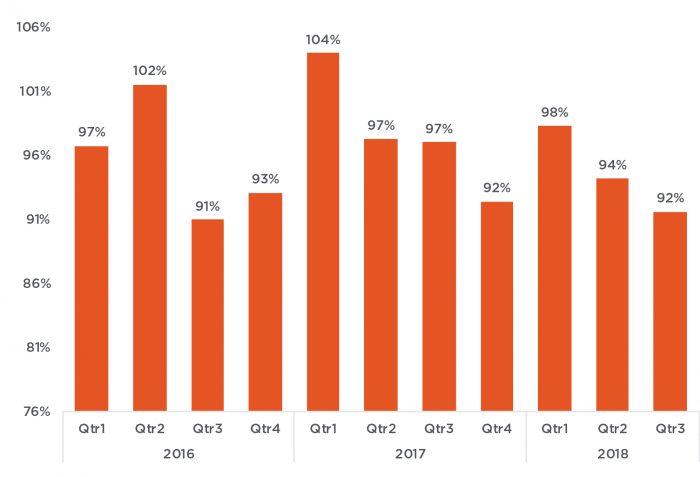
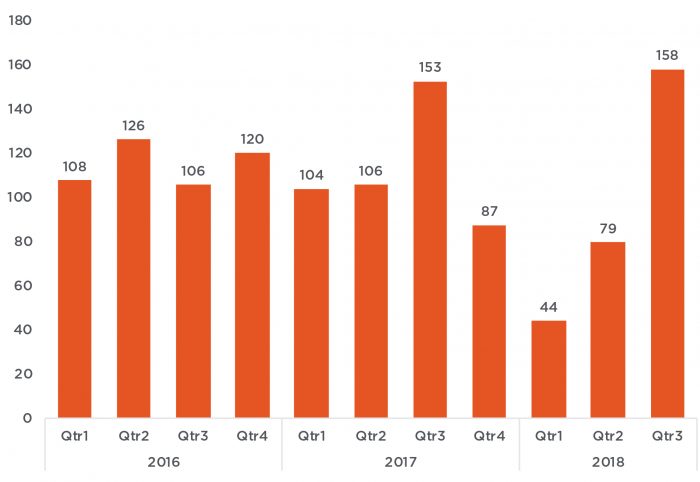
In the Bay Area, the same indicators suggest a different trend. The average sales-price-to-list-price ratio has been declining since this year’s peak in the first quarter at 98 percent. At an average 92 percent sales-price-to-list-price ratio, the third quarter was also below last year’s third quarter but in line with 2016. Nevertheless, the average number of days it took for a home to sell increased notably, from 44 days in the first quarter to 158 days in the third quarter. However, the third quarter of last year also trended closely at 153 days, making it difficult to determine if the increase suggests weaker buyer demand or normalization of the trend back to longer-term average.
Figure 5: Bay Area average list-price-to-sales-price ratio
Source: Terradatum, Inc. from data provided by four local MLSes, Oct. 7, 2018
Figure 6: Bay Area average days on market
Source: Terradatum, Inc. from data provided by four local MLSes, Oct. 7, 2018
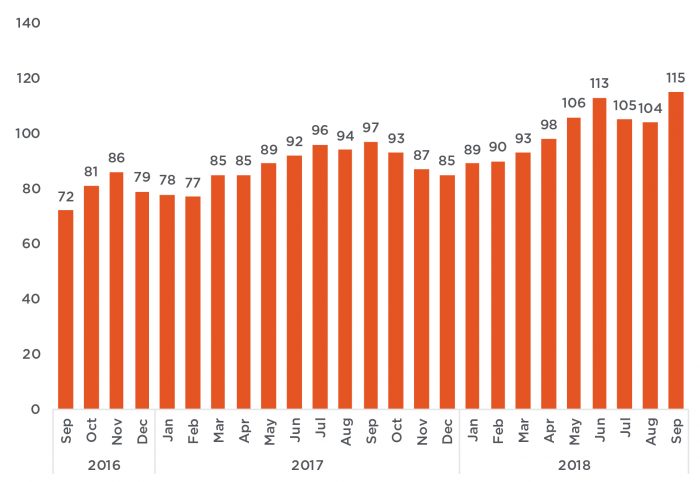
And while inventory has been increasing in both Los Angeles and the Bay Area, Los Angeles has seen a more noticeable improvement in supply in recent months than has the Bay Area. Figure 7 illustrates the average monthly number of homes available for sale priced at more than $20 million. Since the beginning of summer, the average inventory grew to about 109 properties from an average of 90 in the previous 16 months, which is a 21 percent increase.
Figure 7: Los Angeles luxury inventory
Source: Terradatum, Inc. from data provided by TheMLS, Oct. 7, 2018
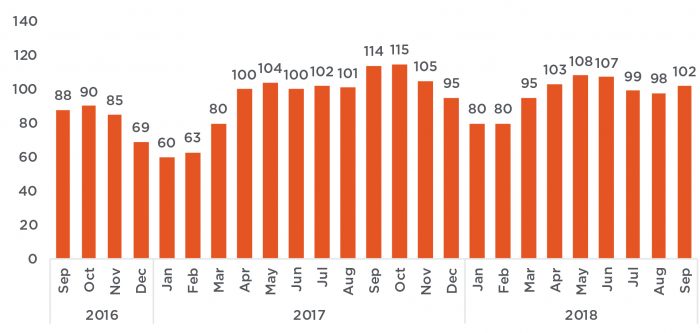
In the Bay Area, while inventory reflects more seasonal patterns, it still suggests that the supply of homes priced at more than $10 million since July has averaged 5 percent below last year following higher levels of inventory in the first five months of 2018. When looking at the entire year, inventory in 2018 is on par with 2017 levels.
Figure 8: Bay Area luxury inventory
Source: Terradatum, Inc. from data provided by four local MLSes, Oct. 7, 2018
Luxury home markets in both Northern and Southern California remain healthy, with activity not substantially different from 2017. However, caution may be warranted, as financial markets have seen more volatility in recent months — particularly those with impacts on California. Also, increased concern with trade, macroeconomic, and geopolitical risks may lead high-end buyers to exercise caution in the coming months.
Selma Hepp is Pacific Union’s Chief Economist and Vice President of Business Intelligence. Her previous positions include Chief Economist at Trulia, senior economist for the California Association of Realtors, and economist and manager of public policy and homeownership at the National Association of Realtors. She holds a Master of Arts in Economics from the State University of New York (SUNY), Buffalo, and a Ph.D. in Urban and Regional Planning and Design from the University of Maryland.
(Promotional photo: iStock/IPGGuternbergUKLtd)
 TEAM WAKELIN