Plenty of open jobs in California while employment growth slows as anticipated
- Following a delay in data release due to the government shutdown, the latest numbers from the state Employment Development Department (EDD) show California added 3,000 jobs in January, bringing the annual growth to 246,400 jobs. That represents a 1.4 percent increase from the year before, compared with the 1.9 percent growth recorded nationwide. In the nine years since the economic expansion started, the state has created a total of 3,115,600 jobs.
- The state’s unemployment rate edged up to 4.2 percent, though the increase was due to a gain in California’s labor force, which grew by 50,200 in January. Labor force increase of 297,100 people over the last year is promising, since the tight market has caused concerns over future employment growth in the state. However, with the recent labor-force growth, the 2019 employment picture looks optimistic. The number of unemployed Californians was 817,600, a decrease of 24,800 from last January.
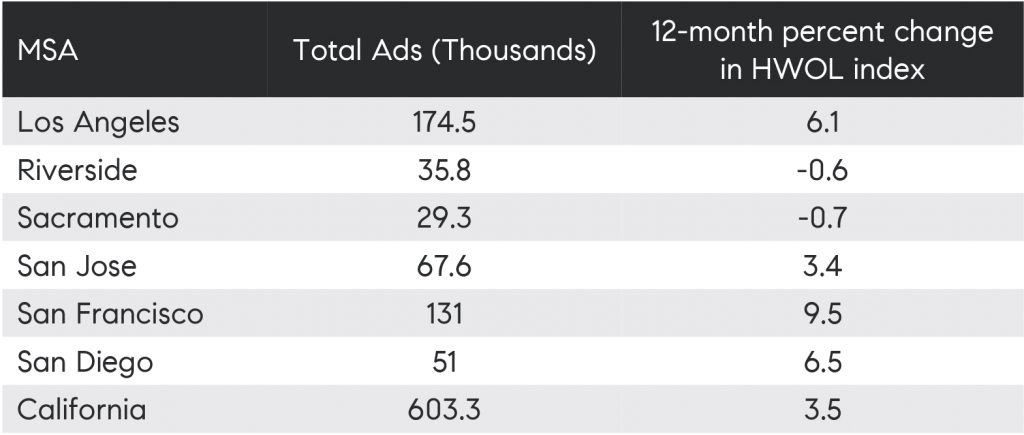
- According to separate data from the Conference Board which tracks Help Wanted OnLine (HWOL) ads, total ads in six major California metropolitan areas in February added up to more than 489,000 open ads and over 603,000 statewide, which is the largest number of ads in any state. The Conference Board index also suggests that the number of ads has increased year-over-year, up 3.5 percent statewide, and the largest increase is in San Francisco with a 9.5 percent increase and 131,000 open ads (see Table 1). In other words, recruitment is likely to remain high in California leading to further tightening of the labor market.
Table 1

- In looking back at EDD data, 7 out of 11 industries added jobs in January, totaling 13,000 jobs, with professional and business services leading the gains (up 4,200 jobs).
- Job losses over the month were concentrated in trade, transportation, and utilities (down 7,200 jobs).
- Over the year, 10 of California’s 11 industries added jobs. The largest gains remained in the professional and business services sector (up by 82,200 positions for a 2.6 percent increase), and education and health services (up by 62,60 jobs for a 2.3 percent increase).
- Only financial services posted an annual decline, with 3,700 fewer jobs compared to last year.
- While most regions show job losses on a seasonally unadjusted basis, seasonally adjusted numbers show that growth was spread out through the state with the Bay Area leading the gains. San Jose added the most jobs, up 5,100, followed by San Francisco, up 3,900, East Bay, up 1,200, and Santa Rosa, up 400. Los Angeles lost 2,600 jobs.
- Los Angeles County lost 92,200 jobs between December and January with largest losses reported in retail trade and mostly in clothing and general merchandising stores, which is typical for the season. Leisure and hospitality also cut 16,900 jobs with more than 70 percent in accommodation and food services. On an annual basis, the region added 30,100 jobs or a 0.7 percent increase. Healthcare and assistance led the gains, with social assistance alone adding 9,300 jobs. Largest declines were in information sectors, with most of the losses in motion picture and sound recording and telecommunications.
- Not seasonally adjusted numbers show that San Francisco and San Mateo counties lost 18,200 jobs between December and January but added 43,900 jobs year-over-year. With a 3.9 percent increase, the two counties had the largest increase over the last year. The region continued to post gains in the professional, scientific, and technical services and information sectors, which accounted for almost half of the total jobs added.
- The San Jose metropolitan area — including Santa Clara and San Benito counties — also lost jobs on a monthly basis, down 15,100 jobs (not seasonally adjusted), and added 28,300 jobs over the year, or 2.6 percent increase. San Jose posted big gains in the tech sector, with most jobs added in information, up 9,200 jobs year-over-year, following by 6,800 jobs added in manufacturing, and 6,000 jobs added in professional and business services. Construction posted a loss of 3,000 jobs.
- Alameda and Contra Costa counties posted a monthly decline of 22,500, and an annual gain of 16,600 jobs, or 1.4 percent increase. The region continued to benefit from the largest gains in the professional and business services industry, which added about half of the annual growth. Financial activities posted annual declines.
- Marin County also posted a monthly decline of 2,200 jobs, and an annual increase of 1,700 or a 1.5 percent. The only sector with annual decline was financial activities, shedding 100 jobs on a yearly basis.
- Napa and Sonoma counties saw a 1.8 percent and a 1.2 percent annual increase in jobs respectively. Napa’s largest increase was in manufacturing, while losses were seen in government, leisure, and information. Sonoma’s largest gains were in construction and losses in government.
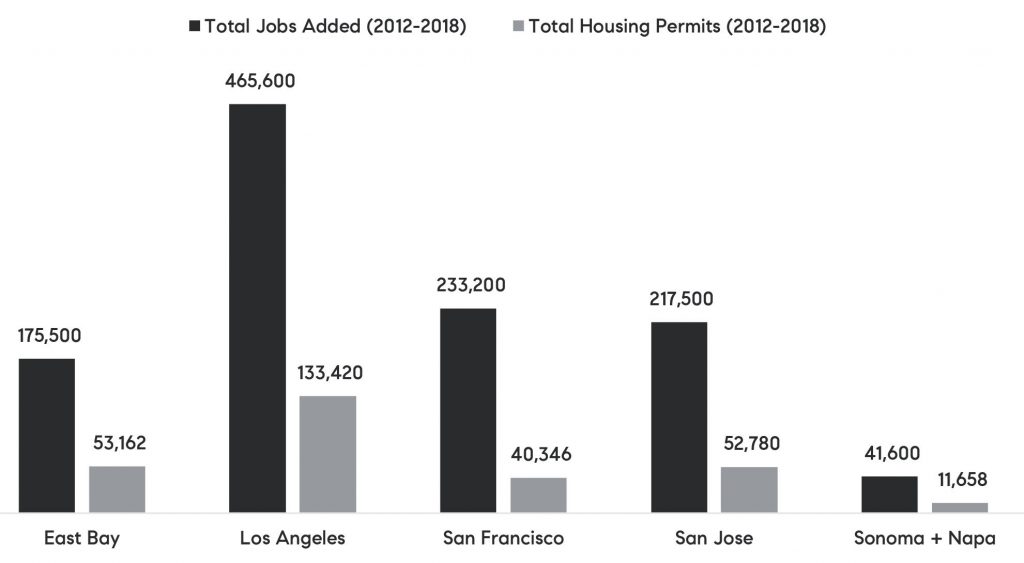
- As the state added over 3.1 million jobs since the economy recovery began, it is important to look at how housing supply managed to match the rate of growth. Table 2 summarizes the number of jobs added from 2012 to now and number of housing units permitted during the same period. The imbalances that range 3 to 4 jobs per 1 housing permit highlight the challenges that remain in ensuring that California’s most productive metropolitan areas provide sufficient housing for new workers and remain attractive to both workers and employers going forward. While discussion around the imbalances are beyond the scope of the current jobs report summary, it is nevertheless important to note in projecting future employment growth in the state.
Table 2

Los Angeles includes Los Angeles County
San Francisco includes San Francisco, Marin, and San Mateo counties
San Jose includes Santa Clara and San Benito counties
 TEAM WAKELIN