 TEAM WAKELIN
Wine Country Home Sales Show Strength in November

Executive Summary:
- Following the Wine Country wildfires, home sales activity increased notably year over year in November, up by 13 percent in Sonoma County and by 24 percent in Marin County but down by 11 percent in Napa County.
- Also, sales were markedly up from October with 16 percent, 17 percent, and 23 percent increases in Marin, Napa, and Sonoma counties respectively. Typically, sales activity slows between October and November.
- While overall inventory continued to decline, October and November were characterized by higher levels of expired or withdrawn listings but also by an increase in new listings when compared with previous trends. Higher levels of expired or withdrawn listings dragged overall inventory down.
- The months’ supply of inventory is now at its lowest level in two years in Sonoma and Marin counties.
- Median prices grew by 16 percent in Sonoma County, 17 percent in Marin County, and 7 percent in Napa County compared with last November — a pattern that was consistent across the Bay Area.
- While preliminary trends suggest that demand for homes has increased following the wildfires, overall tight market conditions in the Bay Area make it difficult to fully gauge the impact of the disaster.
It has been about two months since the raging Wine County wildfires, and assessing the impact on its housing markets is still only preliminary. As we noted in our Bay Area Real Estate and Economic Forecast to 2020, it will take couple of years to understand the full impact of the fires. Unfortunately, wildfires have become a reality of living in California.
Home sales activity picked up considerably in parts of the Wine County in November. Year-over-year sales rose by 13 percent in Sonoma County and 24 percent in Marin County, while dropping by 11 percent in Napa County. The annual increases in Marin and Sonoma counties were the largest among all Bay Area regions, while overall sales in the Bay Area declined by 2 percent. Napa County’s decline was a continuation of trends seen throughout 2017.
On the other hand, between October and November, sales were also up by a solid 23 percent in Sonoma County, 17 percent in Napa County, and 16 percent in Marin County. Typically, sales slow from October to November, with an average decline between 6 percent and 14 percent in those three counties over the last 10 years.
Figure 1 illustrates the somewhat atypical pattern of sales over the last couple of months. While Sonoma County saw some fluctuation during the summer, the three North Bay counties all posted monthly November increases, again inconsistent with previous years’ trends. Delving deeper into local Sonoma County markets showed that sales were up by 18 percent in Santa Rosa and 24 percent in Sonoma Valley year over year in November.
Figure 1: Monthly home sales by North Bay county
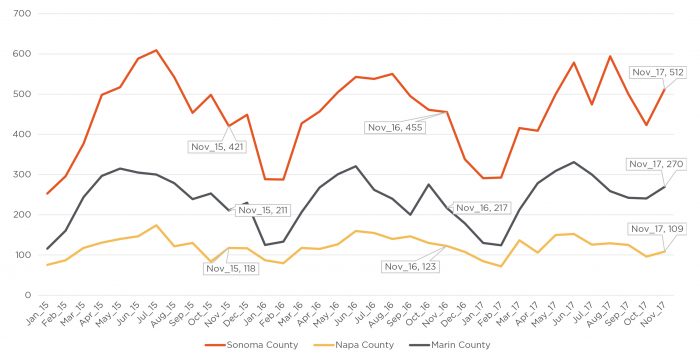
Source: Terradatum, Inc. from data provided by local MLSes, Dec. 6, 2017.
Nevertheless, while sales have picked up, the inventory of homes on the market has continued to fall, but with some important caveats. While overall inventory declined on an annual basis by 10 percent in Sonoma and Napa counties and by 9 percent in Marin County, there were 22 percent more new listings in Sonoma County, 20 percent more in Napa County, and 6 percent more in Marin County. Relatively higher levels of expired or withdrawn listings dragged overall inventory levels down. By comparison, San Mateo County had the largest year-over-year increase in new listings, up 27 percent, while the overall Bay Area had 7 percent more listings than last year. While it is not clear that the increase in new listings was purely driven by the wildfires, last year’s level of new listings in November in the North Bay was on par with 2015.
Declining inventory appears to be the result of an increase in expired or withdrawn listings, especially in Sonoma County, where they jumped by 37 percent, followed by a 4 percent increase Marin County and a 2 percent increase in Napa County. Those were the only three Bay Area counties that showed an increase in expired or withdrawn listings from last November. Overall, the Bay Area saw a 16 percent decline in such listings.
The increase in expired or withdrawn listings, especially in Sonoma County, is in large part due to the disorder that follows a natural disaster. Some of the homes could have been burned or damaged, some were offered for lease instead of sale, and some sellers may be waiting for the market to calm down. In examining expired or withdrawn listings in October and November that were later relisted, there is no clear trend that they were placed on the market for higher prices. On the contrary, out of the 33 homes that were relisted in November, eight were listed with adjusted prices, six were listed at lower prices, and two were listed at higher prices than they were prior to their expiration or withdrawal.
Figure 2 illustrates the monthly number of new listings and expired or withdrawn listings in Sonoma County, with November figures highlighted. The red lines illustrate the change in activity from last year. As expected, October shows a relatively higher number of expired or withdrawn listings than any other month, but the trend also continued in November.
Figure 2: Monthly expired and new listings in Sonoma County.
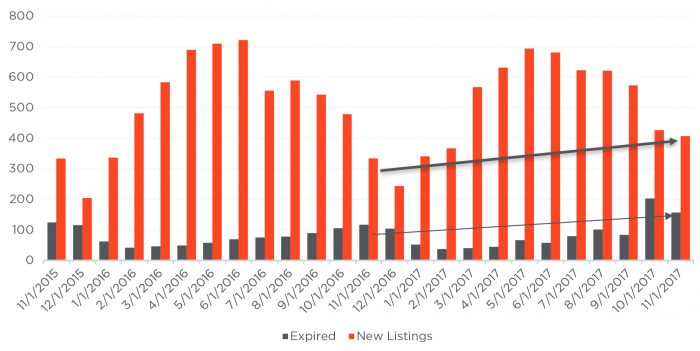
Source: Terradatum, Inc. from data provided by local MLSes, Dec. 6, 2017.
The increase in sales activity coupled with lower inventory led to a decline in the months’ supply of inventory in all three North Bay counties. Figure 3 suggests that Sonoma and Marin counties currently have only a one-month supply of homes on the market if the November rate of sales continues. Inventory in Napa County fell to a 2.6-month supply. All three counties, but particularly Sonoma and Marin, have notably less inventory on both a monthly and yearly basis.
Figure 3: Months’ supply of Inventory in Sonoma, Napa, and Marin counties.
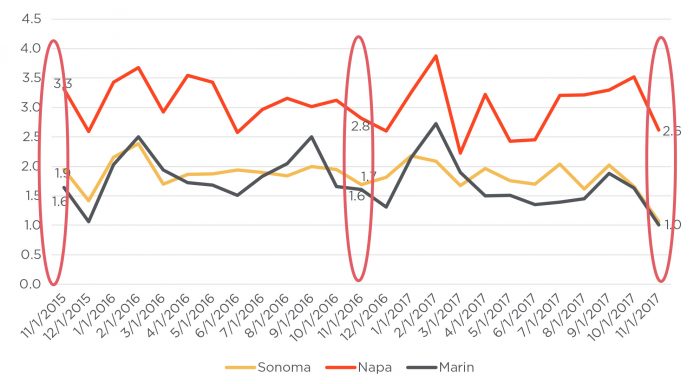
Source: Terradatum, Inc. from data provided by local MLSes, Dec. 6, 2017.
Lastly, and probably most importantly for homebuyers and Wine Country residents, Figure 4 illustrates historical median price trends for single-family homes in the three counties. In November, median prices increased by 16 percent in Sonoma County, 17 percent in Marin County, and 7 percent in Napa County year over year. In Marin County, the current median price for single-family homes stood at $1.217 million. In Napa County, the median price was $657,000, while Sonoma County’s median price stood at $656,900. Among all Bay Area counties, only Napa and Contra Costa have not yet surpassed previous peak prices, though all have seen prices grow by about 100 percent-plus since the market bottomed out in 2010.
Taken together, it is still too early to fully understand the impacts of the wildfires. It takes time for people to adjust and make decisions on next steps. Clearly, many households are looking for homes to rent or buy, which is driving the immediate demand. As anticipated, already tight inventories have gotten tighter, and homes have gotten pricier. Nevertheless, with slim inventory levels across the whole region and home prices surging in most parts of the Bay Area in November, it is difficult to separate the impacts of the wildfires from overall market conditions. We will keep a close eye on changing trends in the coming months.
Figure 4: Median single-family home prices in Marin, Napa, and Sonoma counties
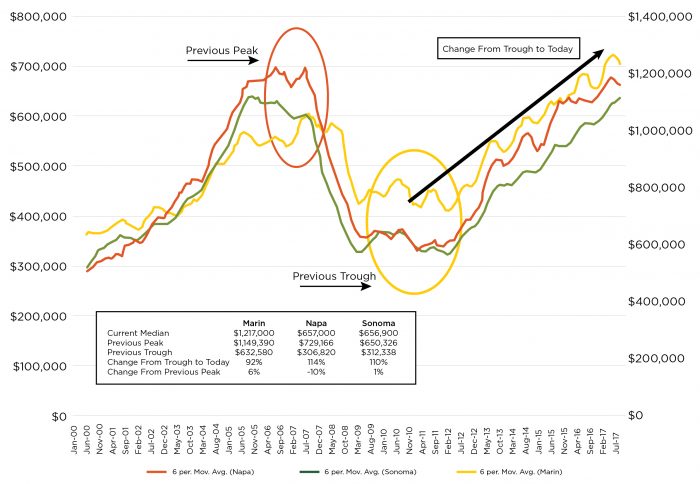
Source: California Association of Realtors
Selma Hepp is Pacific Union’s Chief Economist and Vice President of Business Intelligence. Her previous positions include Chief Economist at Trulia, senior economist for the California Association of Realtors, and economist and manager of public policy and homeownership at the National Association of Realtors. She holds a Master of Arts in Economics from the State University of New York (SUNY), Buffalo, and a Ph.D. in Urban and Regional Planning and Design from the University of Maryland.
(Promotional photo: iStock/TraceRouda)